Study reveals huge growth in Mobile Payments during pandemic
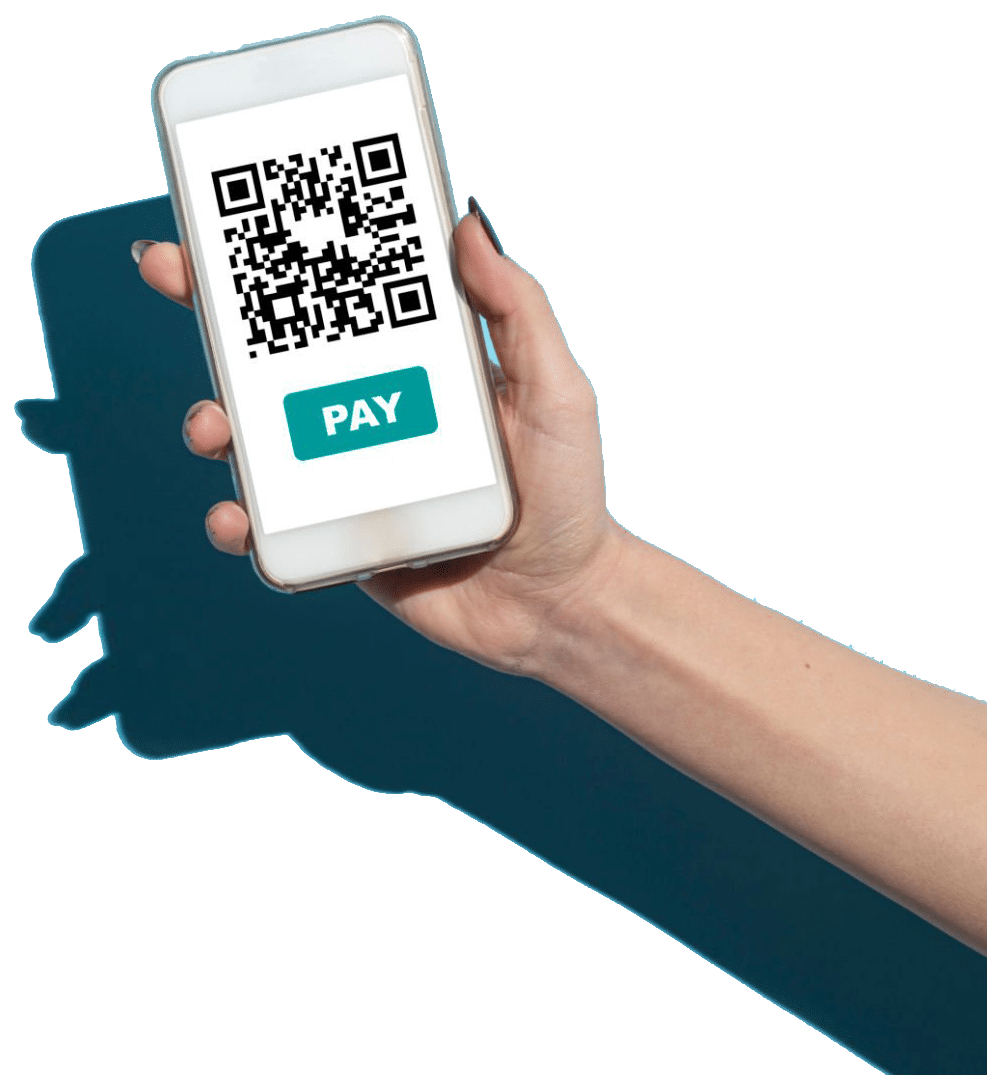
Payment technology has witnessed a significant surge over the last decade and the word ‘fintech’, has become one of the most in-vogue in recent years. Also aided by major developments in hardware technology, in order to make transactions more seamless, this is now effectively a standalone industry.
This study reveals the latest trends in payment technology across a number of different categories and variables, to help illustrate the various changes.
2019 Mobile payment percentage by country
| Country | Percentage |
| China | 81.1 |
| Denmark | 40.9 |
| India | 37.6 |
| South Korea | 36.7 |
| Sweden | 36.2 |
| United States | 29 |
| Canada | 26 |
| Norway | 25.8 |
| Japan | 25.3 |
| Switzerland | 22.3 |
The above table, with the data courtesy of Statista, reflects the volume of payments in the top 10 countries for mobile payment usage. Without a doubt, mobile payments were the most popular form of method for transactions in China during 2019 with a staggering 81.1 per cent.
Interestingly, the US only recorded 29 per cent for mobile payments, when compared to other methods such as cash or a physical card.
Retailer payment data in North America
E-commerce is one sector that has become particularly popular around the world, especially over the last five years and as a result, the number of transactions online has increased significantly. For retailers, it has never been more important to offer as many different payment methods as they can, in order to provide as much choice as possible and try and retain customers. The table below highlights the different methods that retailers use in North America, classified by percentage
| Payment Method | Percentage |
| ApplePay | 50 |
| Masterpass (Mastercard) | 45 |
| Visa | 43 |
| PaPal | 36 |
Perhaps, unsurprisingly, ApplePay leads the way in North America - a native company after all, with 50 per cent of all retail transactions. Incidentally, according to Statista, there are just over 113 million Apple smartphone users in the US - this makes up 47 per cent of all smartphone users in the country. Arguably, the first fintech company - PayPal (a US company), perhaps surprisingly had the fewest amount of transactions in the study with just 36 per cent.
Leading Payment Providers for South Korea in 2026
Another country that seemingly leads the way in mobile payment technology is South Korea, which has, for a number of decades been at the forefront of development, so this may not come as too much of a shock.
Below you can find the leading payment providers for the South Korean market in 2026, with data compiled from Statista.
| Payment Provider | Percentage of users |
| Naver Pay | 73.8 |
| Kakao Pay | 68.8 |
| Samsung Pay | 33.8 |
| Payco | 30.3 |
| Toss | 25.8 |
| Smile Pay | 21.5 |
| Rocket Pay (Coupang) | 18.8 |
| SK Pay | 12.3 |
| SSG Pay | 12.3 |
| L Pay | 9.8 |
A vast number of these payment providers are South Korean companies and arguably the most popular is from smartphone giant Samsung, who in terms of payments are responsible for 33.8 per cent. In 2020, 91 per cent of people surveyed in South Korea claimed to own a Samsung smartphone - an increase of 21.9 per cent from 2011.
Increase of global Mobile Wallets
In emerging markets especially, we have seen a considerable increase in the number of mobile wallets, which are seemingly leading the way in these nations, in terms of payment methods. According to reports, by 2025, the number of mobile wallets in use around the world will reach 4.8 billion - almost 60 per cent of the global population. The table below indicates the number of mobile wallet providers in emerging markets around the world.
| Market | Number of Providers |
| Sub-Saharan Africa | 157 |
| East Asia & Pacific | 49 |
| South Asia | 36 |
| LATAM | 30 |
| MENA | 29 |
| Europe & Central Asia | 9 |
Maybe surprisingly, the African market leads the way in terms of the number of mobile payment providers, though a significant amount of investment has been committed in this niche over the last few years. Indeed, throughout 2018, Sub-Saharan Africa accounted for around 70 percent of all mobile transactions in the world, which translates to 1.7 billion in total.
Mobile Payment App Users globally
As more options have become available over the last few years, we have seen a growing number of people using mobile payments. The table below shows how much this has increased over the last five years.
| Year | Number of users (billions) |
| 2015 | 0.4 |
| 2016 | 0.5 |
| 2017 | 0.8 |
| 2018 | 1.0 |
| 2019 | 1.4 |
| 2020 | 2.3 |
Between 2015 and 2019 there was steady, incremental growth in terms of mobile payment users, however, the considerable increase between 2019 and 2020, undoubtedly is a reflection of the global pandemic and the fact that the vast majority of people were shopping online.
What can we learn from this study?
Based on the tables above, what appears to be the case is that mobile payments are becoming even more popular, perhaps aided by a combination of better infrastructure, more awareness and also as an influence of the global pandemic.
Certainly, emerging markets like Sub-Saharan Africa have a lot of potential and it is perhaps, one of the most interesting findings in the study, with 157 different mobile payment providers available to the market. However, Africa is also a sizable continent, with many different countries, while mobile money is dominating fintech investment here.
Over the next few years, it is likely that mobile payments will further increase, as even more devices develop. Already, people can pay via not just smartphones, but also tablets and even smartwatches, such as the Apple Watch.
Our Methodology
In an independent study brought to you by Pay By Phone Casino into the growth of payment technology during the global pandemic, it was revealed that there was a substantial increase in people using different modes of mobile payment technology, for a wide range of reasons. To illustrate the difference, we also presented data from before the global pandemic, to outline how this has changed.
While there was a clear indicator that fintech has been on the rise for the last decade when considering the popularity of platforms such as PayPal, the pandemic essentially expedited the demand for fintech payment methods, with more people effectively becoming solely reliant on these.
By calculating the percentages of the number of people using different forms of mobile payment methods during the pandemic, we were able to provide an illustration of how important these could be moving forward. This is especially true for different regions around the world, with the data that we collected, helping to formulate which countries could have the biggest impact on the market.
With Statista proving to be a valuable source of data, this helped us to formulate a quantifiable picture for the study.